Local AI search case study

From Website Rebuild to 4,460 Google Generative AI Impressions: The Laser Tagging Inc. Story

AI Search Rankings rebuilt Laser Tagging Inc.'s digital brand and website around the questions families and group planners ask before booking. The work expanded the site's service-area relevance beyond Newark to Fremont, San Jose, and nearby Bay Area communities. In the first reported three-month window, the client-provided Google Search Console report recorded 4,460 Google generative AI impressions across AI Overviews and AI Mode.

Evidence label: Client-reported private Google Search Console data. Public website facts were reviewed, and Google metric definitions are linked below.

Laser Tagging Inc. logo

Newark, California
A 7,000-square-foot, two-story laser tag arena.
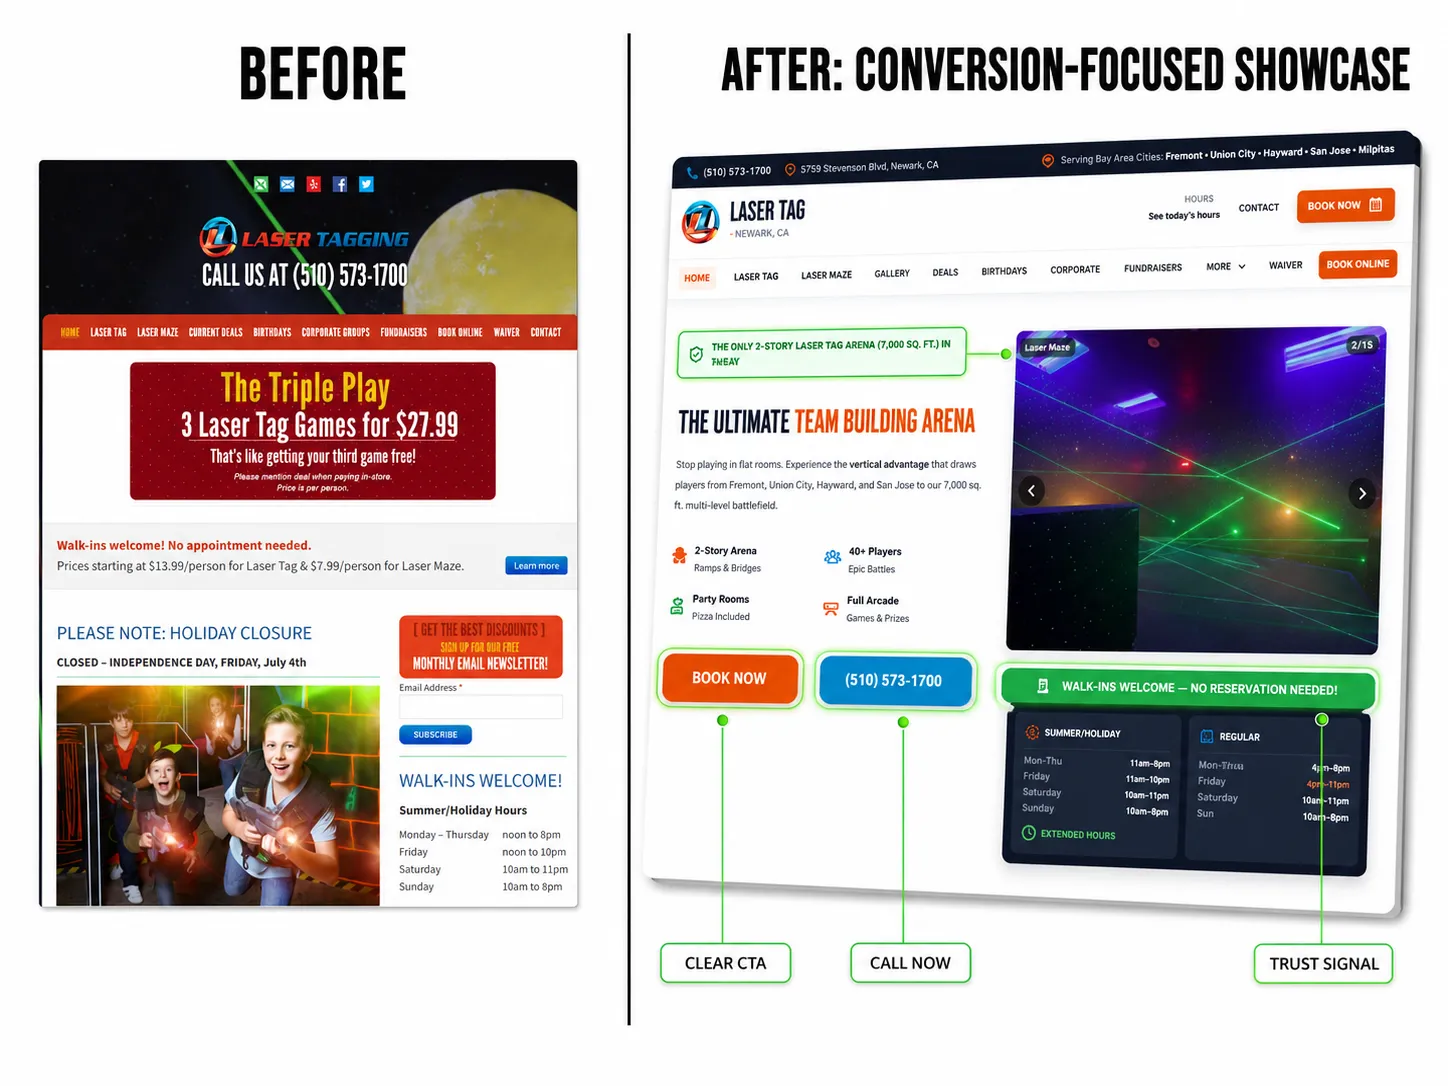
Interactive build reel: Use the controls to compare the conversion, hero, and mobile redesign work. These visuals document the website build; the performance figures come from a separate private Search Console report.
Executive summary

The whole story in four moves

01

Clarify the brand

Turn a dated venue website into a clear local experience for families, groups, and event planners.

02

Build the journey

Connect venue facts, pricing, FAQs, parties, waivers, and booking into one answer-led website system.

03

Expand local reach

Build relevance for customers searching from Fremont, San Jose, and the wider Bay Area.

04

Measure the result

Track the pages, devices, and countries receiving Google generative AI impressions after the rebuild.

Why this story matters to another local business

AI visibility did not come from a single isolated page. The supplied report shows visibility across the customer journey. That is the business lesson: a local brand becomes easier to find and understand when its website answers the real questions that lead to a call, visit, waiver, or booking.

Measurement summary

The reported result, with the measurement limits visible

The headline uses the property-level chart total. The page table is reported separately because Google aggregates those views differently.

4,460
Google generative AI impressions
Property-level total for AI Overviews and AI Mode, client-reported.
0
Prior period reported
Shown in the previous-three-month comparison column.
10
Pages in the table
Commercial, informational, waiver, and booking URLs.
3
Months selected
Compared with the previous three months.

Key takeaway

The visibility was not limited to the homepage. Pricing, FAQ, birthday, service, waiver, booking, and arena pages all appeared in the supplied page report. That distribution shows why a clear local entity and a complete customer journey matter for AI search readiness.

Three performance views

How the Google generative AI impressions were distributed

These charts show device balance, page concentration, and country concentration for the supplied last-three-month data. They measure impressions, not visits, citations, clicks, or bookings.

The messy middle: the totals did not match

The property chart reported 4,460 impressions. The 10 supplied page rows total 4,887, and the device rows total 4,462. The easy marketing choice would have been to select one number and hide the conflict. We chose the more useful path: preserve every supplied value, label each scope, and explain Google's aggregation rules.

Impressions by device

Mobile and desktop were closely balanced. Mobile represented 51.5% of the supplied device rows, while desktop represented 47.6%.

Impressions by device for the last three months Horizontal bar chart showing mobile with 2,298 impressions, desktop with 2,122, and tablet with 42. Mobile 2,298 Desktop 2,122 Tablet 42
The device rows total 4,462, which is 2 more than the 4,460 property-level total. Both are shown as supplied rather than silently adjusted.
Mobile 2,298 impressions
Desktop 2,122 impressions
Tablet 42 impressions

Country distribution

The United States accounted for 92.4% of the property-level total. The lower panel uses a separate scale so the supplied non-US country values remain readable.

Country distribution of impressions for the last three months The United States had 4,123 impressions. Canada had 47, India 26, the United Kingdom 17, and South Africa 16. The other 78 countries account for a derived combined 231 impressions. Property-level overview United States: 4,123 Outside US: 337 Supplied non-US country detail, separate scale Canada 47 India 26 United Kingdom 17 South Africa 16
Five country rows were supplied from 83 total countries. The remaining 78 countries equal a derived combined 231 impressions when subtracted from the property-level total. No individual values were invented.

Top 10 pages by impressions

The homepage and pricing page generated 71.2% of the supplied top-10 page-row impressions. The other pages extend visibility through the customer research and booking journey.

4,887 supplied page-row impressions
Top 10 Laser Tagging Inc. pages by impressions for the last three months The homepage had 2,487 impressions, pricing 991, FAQ 363, birthdays 346, laser tag 277, waiver 192, laser maze 78, all-night laser tag 64, booking 45, and arena 44. / 2,487 /pricing.php 991 /faq.php 363 /birthdays.php 346 /laser-tag.php 277 /waiver.php 192 /laser-maze.php 78 /all-night-laser-tag.php 64 /booking.php 45 /arena.php 44
Ten page rows were supplied from 28 total pages. Page-level rows can add to more than the property total because Google aggregates page and property views differently.

Restricted evidence source

The supporting Google Sheet is private. Open the link and use Google's request-access flow. Access approval is controlled by the sheet owner. The charts on this page use only the values supplied for publication.

Request access to the Laser Tagging Inc. evidence sheet
Chapter 1: The starting friction

A local venue with many decision-stage questions

Laser Tagging Inc. operates in Newark, California. Its public website describes a 7,000-square-foot, two-story arena, party rooms, a laser maze, an arcade, and booking options for birthdays, groups, and walk-in visits.

Potential customers need quick answers about price, age and safety rules, waivers, party packages, availability, and what the venue offers. A single generic page cannot answer that full decision journey well.

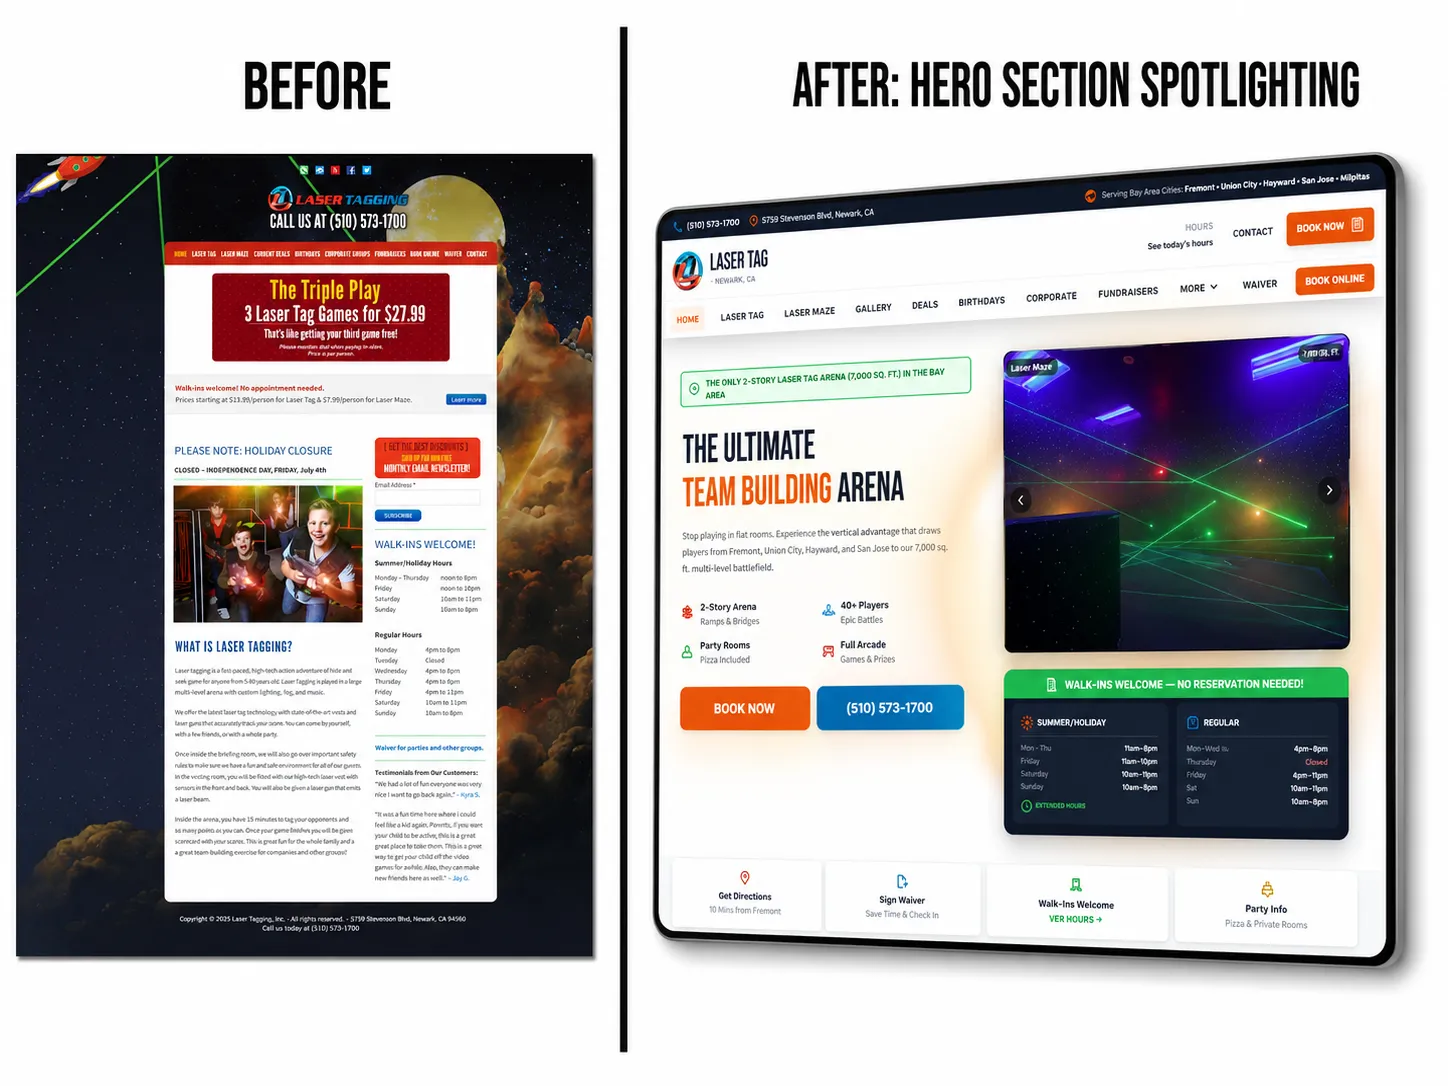
Before and after comparison of the Laser Tagging Inc. homepage hero
The redesigned hero puts the business identity, venue details, booking action, waiver access, and hours into a clearer path.
Chapter 2: The connected rebuild

AI Search Rankings built one system for people, search, and booking

The new digital brand and website could not treat content, structured data, mobile UX, and conversion as separate tasks. Each part needed to reinforce the same business story.

Clear local entity facts

The live site connects the business name, Newark location, venue type, phone, address, hours, and offers in visible content and structured data.

  • LocalBusiness and entertainment entity markup
  • Consistent contact and location facts
  • Explicit venue and service descriptions

Answer-led commercial pages

Pricing, FAQ, birthday, laser tag, laser maze, and all-night event pages give each high-intent topic a focused and crawlable answer.

  • Specific page purpose and headings
  • Visible price and package information
  • FAQ content aligned with customer questions

Complete action paths

Visitors can move from research to practical next steps without searching for the waiver, booking page, phone number, or venue details.

  • Waiver path before arrival
  • Booking path for decision-stage users
  • Phone and location support for recovery
Bay Area service-area expansion

Expanding visibility beyond Newark across the Bay Area

AI Search Rankings helped Laser Tagging Inc. broaden its geographic search visibility so more families, group planners, and event organizers outside Newark could discover and evaluate the venue.

The local strategy strengthened relevance for high-value nearby markets such as Fremont and San Jose, while also supporting discovery from Union City, Hayward, Milpitas, Santa Clara, and surrounding Bay Area communities. The website connects that wider reach to the questions people ask about laser tag, birthday parties, group events, pricing, waivers, and booking.

One venue, a wider customer catchment

Laser Tagging Inc. remains a Newark venue. Fremont, San Jose, and the other cities named here are customer service and discovery areas, not additional physical locations.

Service-area visibility map

Home venueNewark
Priority areaFremont
Priority areaSan Jose
Wider reachBay Area

Measurement boundary: The supplied three-month Search Console report does not provide city-level impression totals. This section describes the service-area strategy and does not assign unverified performance numbers to any city.

Chapter 3: The three-month result

Top pages by Google generative AI impressions

Each value below was supplied from the client-controlled Search Console property. “Previous” is shown as reported in the comparison column.

Property-level total 4,460
Page-row sum 4,887
Client-reported Google Search Console page rows for the selected last-three-month period compared with the previous three months.
Page Last 3 months Previous 3 months Absolute change
Homepage 2,487 0 +2,487
Pricing 991 0 +991
FAQ 363 0 +363
Birthdays 346 0 +346
Laser Tag 277 0 +277
Waiver 192 0 +192
Laser Maze 78 0 +78
All-Night Laser Tag 64 0 +64
Booking 45 0 +45
Arena 44 0 +44
Sum of supplied page rows 4,887 0 +4,887

Why 4,460 and 4,887 are both shown

The headline is the property-level chart total: 4,460. The 10 supplied page rows total 4,887. Google explains that property aggregation counts a property once while page aggregation can count more than one URL from the same property, so the views may not match. We keep both totals visible instead of forcing an artificial reconciliation.

Read Google's aggregation guidance
Chapter 4: What the result means

What this result means, and what it does not mean

Clear boundaries make the case study more useful. They separate the measured signal from interpretation and business outcomes.

Supported by the supplied report

  • 4,460 property-level generative AI impressions in the selected view
  • 0 reported in the previous-period comparison column
  • Impressions distributed across 10 supplied page rows
  • Coverage of both informational and booking-journey content

Not measured by this report

  • Whether the brand was quoted or cited in an AI answer
  • Query-level rank, recommendation share, or local pack position
  • Clicks, calls, bookings, leads, or revenue
  • Exclusive causal credit for any single website change

Performance source disclosure

Source: Google Search Console, Generative AI performance report for the client-controlled lasertagginginc.com property. The selected view compared the last three months with the previous three months. Google defines the metric as impressions of links shown in AI Overviews and AI Mode. The private property report was supplied for this case study and is not publicly accessible. Exported zeros can represent values shown as approximately zero or unavailable in the interface.

Frictionless journey

The mobile experience keeps the next action clear

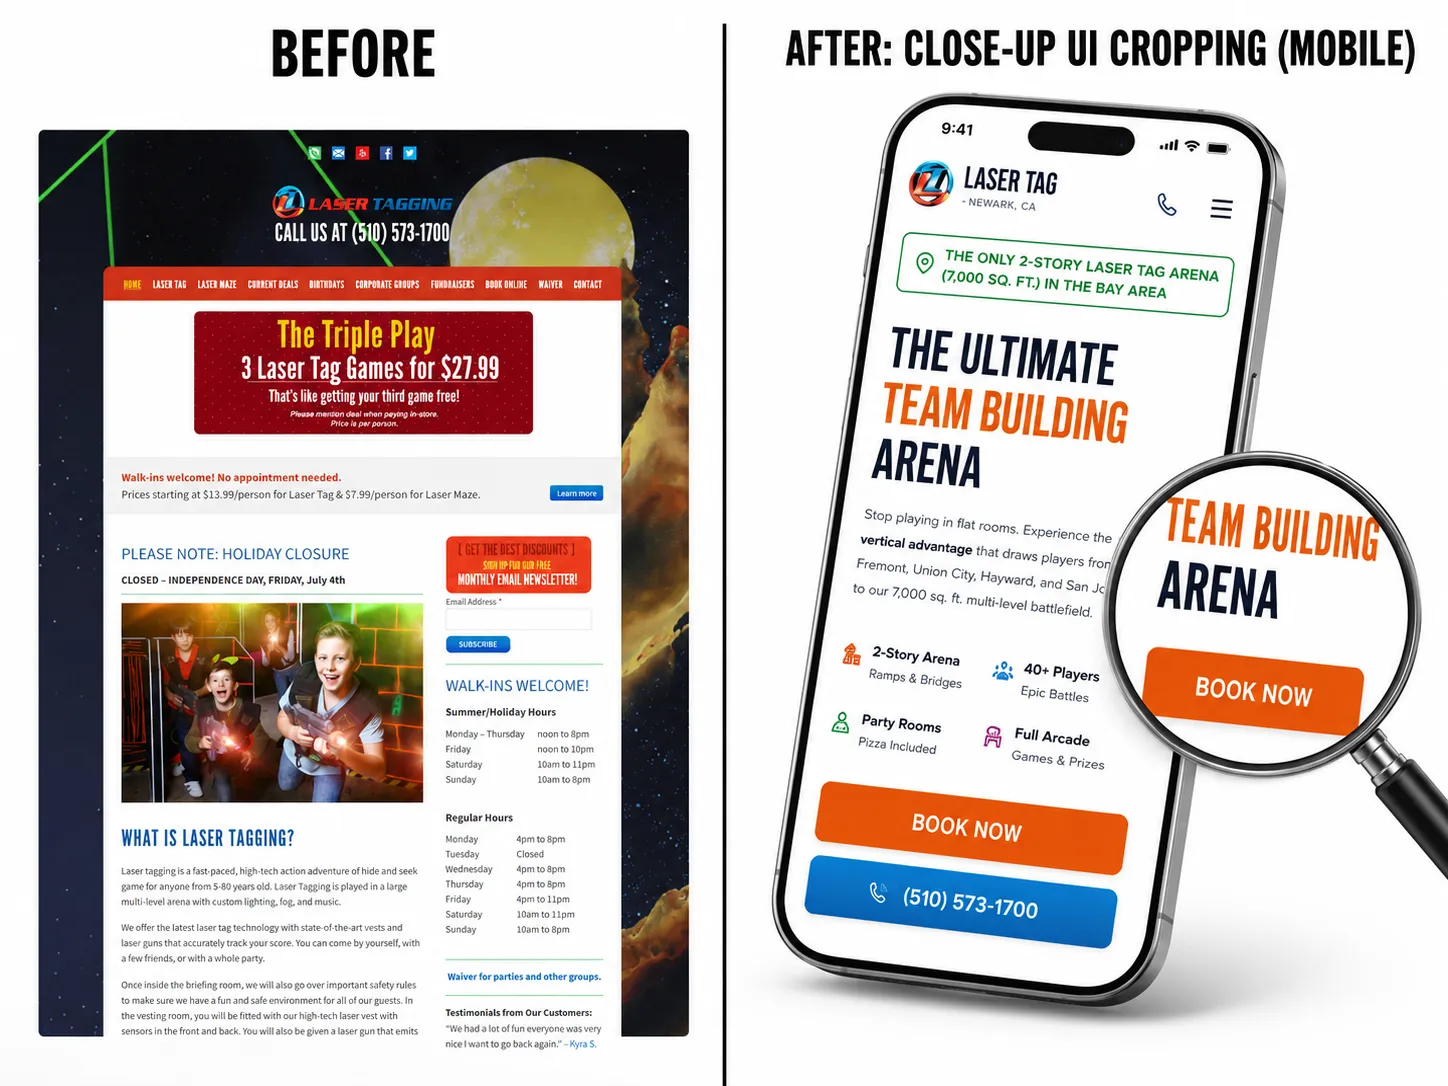
Local venue research often happens on a phone. The redesigned experience brings the core offer, phone action, booking path, venue facts, and navigation into a compact mobile flow.

This image documents the interface work. It is not presented as proof of the Search Console result.

Before and after comparison of the Laser Tagging Inc. mobile website experience
A focused mobile hero reduces the steps needed to understand the venue and reach booking support.
The Local Answer System

A reusable path for local businesses

The work maps to the six stages in the AI Search Rankings local visibility framework: Find, Fix, Structure, Prove, Track, and Grow.

01

Find

Inventory the business facts, customer questions, offer pages, local signals, and conversion paths that already exist.

02

Fix

Repair the dated hierarchy, unclear venue story, mobile friction, and missing paths to calls, waivers, and bookings.

03

Structure

Give pricing, FAQs, birthdays, games, the arena, waivers, and booking their own crawlable and answer-led surfaces.

04

Prove

Connect visible venue details, public business facts, service information, and matching structured data.

05

Track

Measure Google generative AI impressions by property, page, device, and country without renaming the metric.

06

Grow

Use the visible page distribution to decide which answers and booking-journey surfaces deserve the next improvement.

The strategic decision tree

The value was not simply in what we built. It was also in what we chose not to do.

Decision 1: One page or a customer journey?

Rejected: One generic page trying to rank for every venue question.

Chosen: Focused pages that move a visitor from discovery to pricing, trust, waiver, and booking.

Decision 2: Schema alone or visible clarity?

Rejected: Adding markup around weak or incomplete page content.

Chosen: Visible business facts and answers first, followed by structured data that matches them.

Decision 3: A big claim or an honest metric?

Rejected: Calling impressions citations, rankings, traffic, or revenue.

Chosen: Preserve the Search Console metric, disclose the aggregation gap, and show the source.

60-second fit check for your local business

  • Your customers ask the same pricing, service, safety, location, or booking questions before they contact you.
  • Your website has useful facts, but they are buried, inconsistent, or spread across disconnected pages.
  • You want to measure AI visibility without confusing impressions, citations, clicks, leads, and revenue.

If these statements describe your website, the Local Answer System is designed for the same type of friction shown in this case study.

Technical deep track

Open the implementation details

Decision-makers can keep the executive summary. Technical buyers can expand the architecture, structured data, page surfaces, and measurement logic below.

Review our schema service

The rebuild created a clearer venue identity, a stronger offer hierarchy, a mobile-first booking path, direct phone and waiver actions, and focused sections for the questions that cause hesitation. Each surface helps a person make a decision while also giving search systems a clearer business model.

Understand

Homepage, arena, laser tag, and laser maze pages explain what the venue is and what people can do.

Compare

Pricing, birthday, all-night event, and FAQ pages help visitors compare options and resolve objections.

Prepare

The waiver page removes a practical arrival task before the customer reaches the venue.

Act

The booking page and phone actions give a clear next step when the customer is ready.

The live site exposes LocalBusiness and entertainment business entity markup, public business facts, and FAQPage markup where the visible page supports it. The case study itself uses Article, FAQPage, ItemList, BreadcrumbList, Organization, Person, and Speakable markup through one deduplicated JSON-LD graph.

The headline uses the 4,460 property-level Google generative AI impression total. The page chart uses the 4,887 sum of 10 supplied page rows. The device chart uses the 4,462 sum of supplied device rows. The country view uses the five supplied country rows and derives only the combined remainder. The page does not infer hidden rows or convert impressions into financial outcomes.

Why there is no ROI calculator on this page

The supplied report does not include clicks, calls, booking conversions, average booking value, project cost, or revenue. Any ROI estimate would require invented assumptions. The honest next step is to connect visibility data with the client's booking and revenue systems before calculating financial return.

Discuss a measurement plan for your business
Questions answered

Laser Tagging Inc. case study FAQ

The answers use the same definitions and limitations as the report above.

The client-provided Google Search Console Generative AI performance report showed 4,460 property-level impressions in the selected last-three-month period. The comparison column reported 0 for the previous three months.

Google uses different aggregation for property totals and page totals. A property can be counted once at the property level while more than one URL from that property can receive page-level impressions. The two totals therefore may not match.

No. An impression means a link from the site was shown in Google AI Overviews or AI Mode. This report does not prove a citation, a first-place ranking, a click, a booking, or revenue.

The live website gives search systems clear local business facts, structured data, answer-led pricing and FAQ content, service and event pages, and direct waiver and booking paths. These elements make the business and its offers easier to understand.

AI Search Rankings broadened the website's local relevance beyond Newark to help customers in Fremont, San Jose, Union City, Hayward, Milpitas, Santa Clara, and nearby Bay Area communities discover and evaluate the venue. These are customer catchment areas, not additional Laser Tagging Inc. locations. The supplied report does not provide city-level impression totals.

No. AI visibility depends on the market, website, competition, search demand, source quality, and platform changes. AI Search Rankings can improve readiness and measurement, but it does not guarantee rankings, citations, impressions, leads, or revenue.
Continue your research

Local SEO

Connect local facts, service intent, and customer actions.

Explore local SEO services

Schema markup

Make visible business facts easier for machines to interpret.

Explore schema markup services

Google AI visibility

Improve readiness for AI Overviews and AI Mode.

Explore Google AI optimization

Case study library

Compare this result with other documented engagements.

Browse all case studies

Methodology and sources appendix

Every metric and public business fact used in this case study points to its governing source.

Choose the next step that matches your website

Start with the problem you already know you have. We will connect the brand, website, AI visibility, and measurement work from there.

My website needs a clearer brand and booking journey

Choose this path if your offer is hard to understand, your pages feel dated, or customers struggle to find the next action.

Discuss a Brand and Website Rebuild

My website is live, but I do not know if AI can find it

Choose this path if your website already converts but you need entity, answer coverage, schema, and AI visibility measurement.

Request an AI Visibility Audit

The initial consultation is free. Responds within 2 business hours.

Reviewed by Jagdeep Singh, Founder and lead Answer Engine Optimization strategist.

Published August 10, 2026, and last reviewed August 11, 2026. Performance source: private client Search Console report. Public business facts were checked against LaserTaggingInc.com.